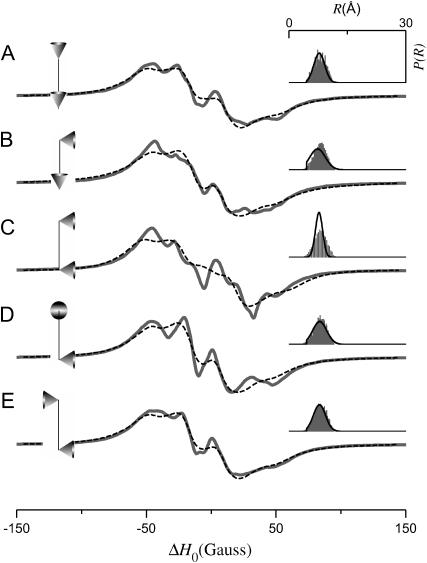
FIGURE 7.
EPR spectra (solid gray lines) calculated for the tether-in-a-cone model to show the effect of cone orientation for 〈R〉 ≈ 8 Å and σR ≈ 1.5 Å. The values of p, q, μmax, ψ1, ζ2, and ψ2 are given in Table 1. For all calculations, α = β = γ = 0°. The fits obtained by the Fourier convolution method are shown as dashed black lines. The diagrams to the left of each panel represent the relative orientation of the cones as determined by ψ1, ζ2, and ψ2. The insets to the right show the actual distance distribution (gray histogram) for the simulated EPR spectrum and the distance distribution (black line) obtained by the Fourier convolution method.

