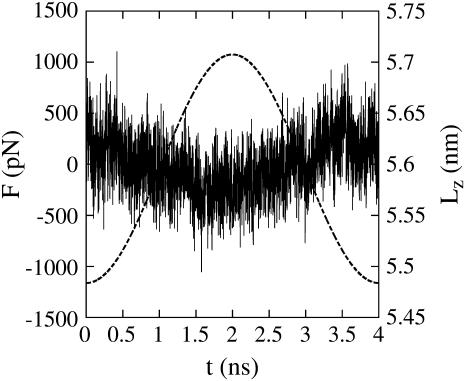
FIGURE 2.
Force (left axis, solid line) and extension (right axis, dashed line) versus time t for a single cyclic expansion NEMD trajectory at λ = 4 ns, as in Eq. 1. Each point of the force curve is the average force of the preceding 1000 time steps.

