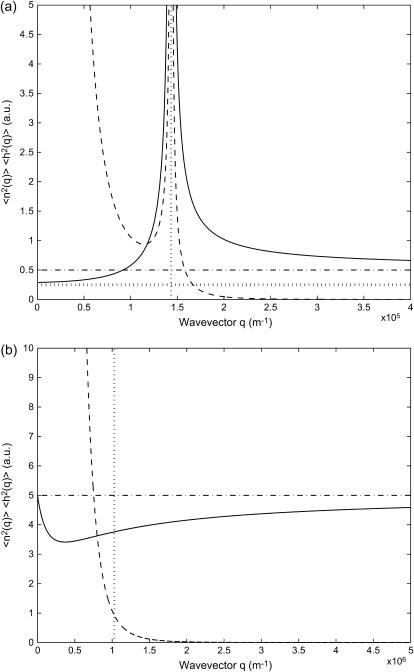
FIGURE 4.
Calculated static density and membrane height correlation functions: 〈n2(q)〉, solid line; 〈h2(q)〉, dashed line. (a)  : the correlations diverge at the critical wavevector qc (Eq. 6), indicated by the vertical dotted line. The limiting values 〈n2(0)〉 (Eq. 14) and 〈n2(∞)〉 (Eq. 15) are shown by the horizontal dotted and dashed-dotted line, respectively. (b)
  : the density correlations dip for wavevectors q < qw (Eq. 8), indicated by the vertical dotted line. The height correlations show a monotonous decay, having a crossover from 1/q4 to 1/q6 behavior around qw. The limiting value 〈n2(∞)〉 (Eq. 15) is shown by the horizontal dashed-dotted line.

