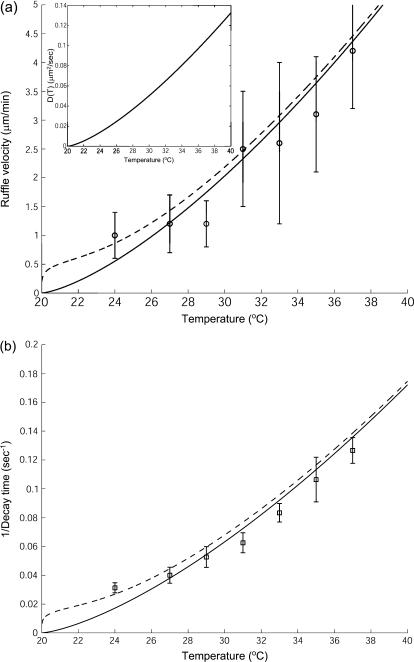
FIGURE 8.
(a) Calculated velocity of actin-induced membrane ruffles veff (Eqs. 9 and 10) (dashed line), where D(T) is shown in the inset and D′(T) = 0.02/|T − Tm| (μm2/s). The solid line gives veff in the limit D′ = 0. The experimental data (○) are from Neto et al. (61). (b) Calculated decay time of actin-induced membrane fluctuations: τdecay ∝ 1/D(T) (solid line), compared to the experimental data (□) (61).

