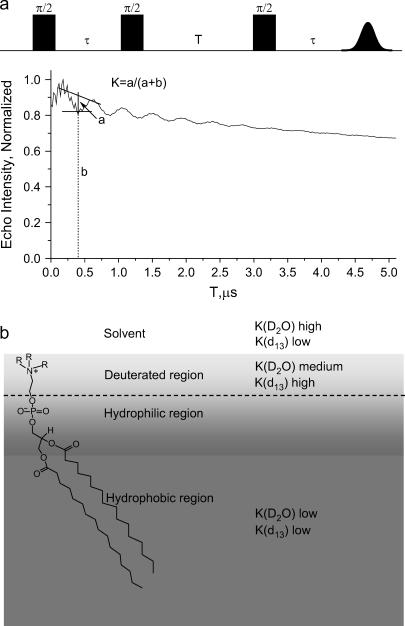
FIGURE 1.
(a) The three-pulse ESEEM sequence and the ESEEM waveform with the definition of the modulation depth, K(2H). (b) A schematic representation of the various regions of the model membrane and the expected modulation depth for a spin label located within the different regions. The gradient in the gray color distinguishes between the hydrophilic and hydrophobic regions.

