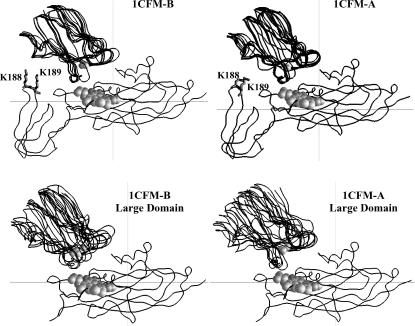
FIGURE 4.
Orientations of the complexes formed for PC interacting with cyt f. The peptide backbones are shown for complexes formed with 1CFM-B (which showed the highest interaction rates) and the 1CFM-A (which had the smallest interaction rates). For each cyt f, five complexes, with cutoff distances less than the peak distances (Fig. 3 A) , were randomly chosen. The overlays were done using program GRASP (50). The cyt f heme and the cu atoms in PCs are in gray and shown as space-filling models.

