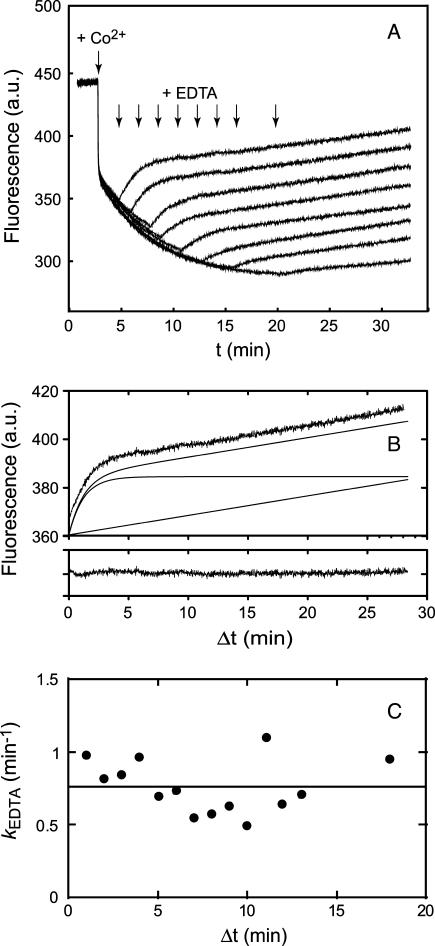
FIGURE 7.
EDTA sensitivity of intermediates in the cobalt binding reaction. (A) Fluorescence time courses observed for reaction of apo-MnSOD (50 μg/mL in 20 mM MOPS, pH 7, 45°C) with reaction initiated by addition of CoCl2 and subsequently interrupted by addition of EDTA to a final concentration of 80 μM. (B) Decomposition of the fluorescence time course observed for addition of EDTA 1 min after initiating cobalt uptake. Raw data (top trace) was decomposed into a single exponential relaxation plus a linear term (lower traces). The residuals resulting from the fit are shown below. (C) Variation of rate constant for cobalt extraction by EDTA with time. The values of kEDTA from analysis of the kinetic traces (open circles) is shown together with the regression line for a constant value (kEDTA = 0.75 min−1).

