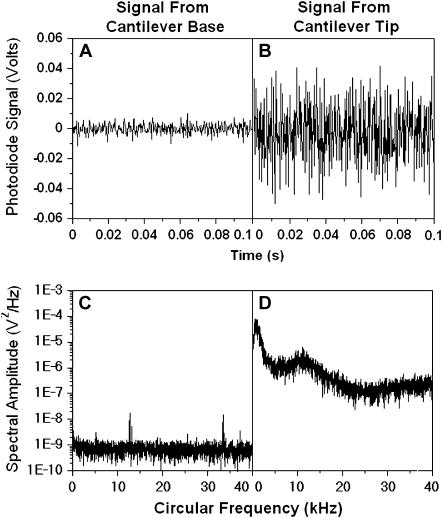
FIGURE 3.
Comparison of photodiode signals (A and B, in volts) and their power spectra (C and D, in V2/Hz) recorded when the laser was reflected from the wafer where the cantilever base was mounted (A and C) with those when the laser was reflected from the cantilever tip (B and D). The respective variances of the fluctuating voltages in panels A and B are 1.58 × 10⁻⁵ and 4.2 × 10⁻⁴.

