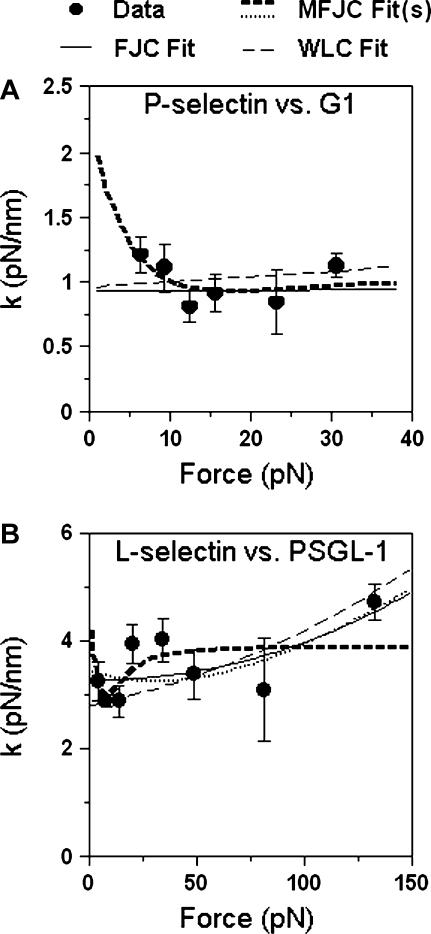
FIGURE 9.
Molecular spring constants of P-selectin-G1 complex (A, 86 measurements) and L-selectin-PSGL-1 complex (B, 106 measurements) measured in a range of fixed forces by the thermal method (points, mean ± SE) are compared to fits (curves) by the three polymer elastic models (Eq. 11). The best-fit FJC model parameters are, respectively, L = 1107 nm and l = 0.12 nm (A) and L = 90.9 nm and l = 0.04 nm (B). The best-fit WLC model parameters are, respectively, L = 292 nm and l = 0.022 nm (A) and L = 114 nm and l = 0.02 nm (B). The best-fit MFJC model parameters for the P-selectin-G1 complex are: L = 9.89 nm, l = 0.53 nm, and km = 1.05 pN/nm (A). Two sets of MFJC model parameters for the L-selectin-PSGL-1 complex are presented in the text; these correspond to two very distinct curves (dark dashed and light dotted) with similar goodness of fit. Part of the light dotted curve is obscured because it overlaps with the light solid curve of the FJC fit (B). The respective spring constants (mean ± SE) for P-selectin-G1 and L-selectin-PSGL-1 averaged from all data over their respective force ranges are 0.99 ± 0.11 and 3.3 ± 0.15 pN/nm, respectively.

