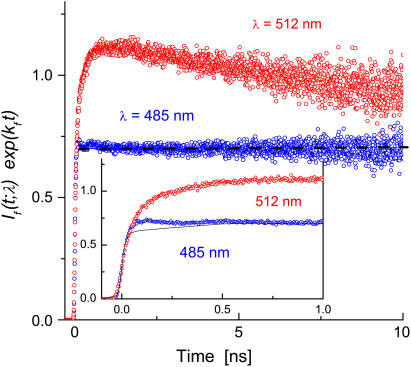
FIGURE 4.
Transient TCSPC fluorescence at 485 nm (87 K or 151 K) and 512 nm (110 K) in a 60% (v/v) glycerol-water solution. Data corrected for ES decay using kf = 0.352 ns−1. Dashed straight line to guide the eye. Inset shows the data on an expanded scale with the line representing the IRF convoluted with a constant.

