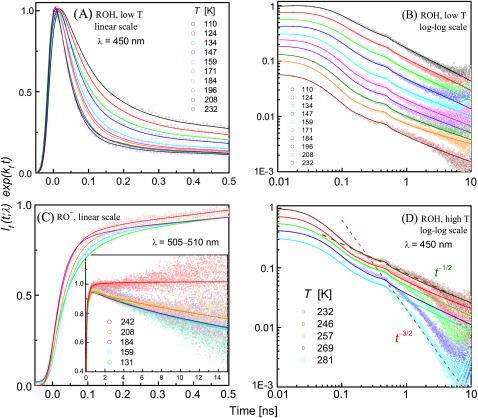
FIGURE 5.
Time-resolved emission from wt-GFP in a 30% (v/v) glycerol-water solution at the different indicated temperatures (in K). Circles are TCSPC data corrected for the ES lifetime. Lines are fits to the diffusion model in Eqs. 3–6 using the SSDP software (18) with the parameters in Table 1. The calculated P(t) was convoluted with the measured IRF. (A) Low temperature ROH fluorescence at 450 nm on a linear 500-ps timescale, normalized to unity at the peak. (B) Same data on a 10-ns time window and a log-log scale, with curves shifted each by ∼0.12 log units along the intensity scale for clearer visibility of the long-time tails. (C) Anion (RO−) fluorescence, measured at 505–510 nm, depicted on both short and long (inset) timescales. (D) Same as B, above the transition temperature. The two dashed lines depict t−1/2 and t−3/2 decay, illustrating the transition.

