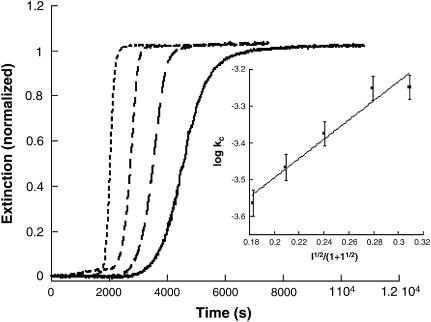
FIGURE 5.
Overlay of normalized representative kinetic profiles for insulin gelation at various ionic strengths (NaCl). Shown in the figure (from right to left) are [NaCl] = 0.050, 0.070, 0.10, and 0.15.The conditions were 200 μM insulin, pH 1.62, 67°C. (Inset) Plot of log kc versus I1/2/(1 + I1/2) for insulin gelation in the presence of NaCl. The slope of the line is +2.6 ± 0.3, indicating interaction between two species of like charge type.

