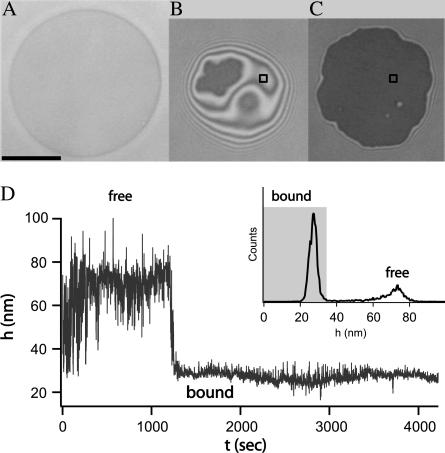
FIGURE 1.
Different stages of the adhesion process of a single vesicle. The scale bar indicates the length of 10 μm. (A) The bright field picture of the vesicle. (B) Coexistence of a patch of strong adhesion (dark) and region of contact of the weak adhesion (bright area exhibiting interference fringes). (C) Adhesion after the shape transition induced by the growth of the patch to its maximum size associated with the aggregation of the ligand-receptor bonds. (D) Height of the membrane as a function of time for a square point that is shown in panels B and C. The inset contains the resulting histogram of heights. The bound state is defined by the peak in the distribution and is shaded in gray.

