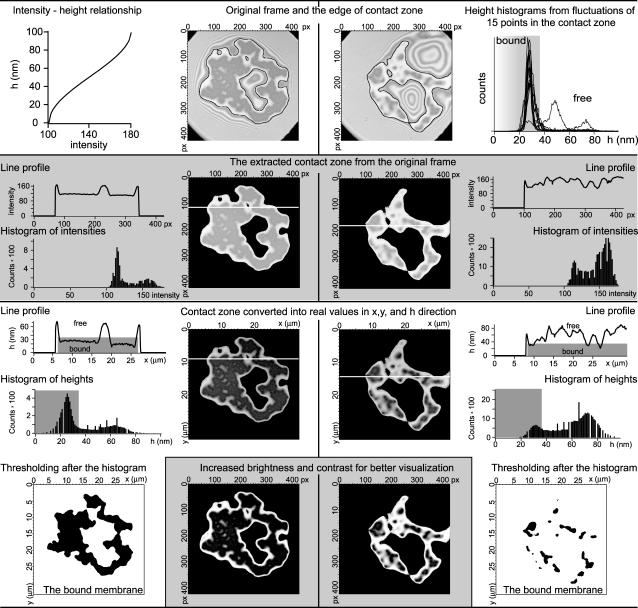
FIGURE 12.
Schematic presentation of the data analysis procedure. Two frames, one from the beginning and one from the end of the deadhesion experiment, are analyzed in parallel. The procedure is presented in parallel for two frames. The scheme is organized in rows, alternating the white and gray background color of the row, each row representing a particular stage of the procedure. (First row) Graph where the intensity of the gray color is correlated to the height above the substrate (left). Original frames are shown with the outline of the edge of the contact zone (middle). Histogram of heights constructed from the analysis of the dependence of the height of the membrane in 15 different points in the contact zone (right). The area shaded in gray denotes the heights that are associated with the bound membrane and provides the cutoff for the bound state. (Second row) Extraction of the contact zone (the 100 nm closest to the substrate). The resulting frames are presented in the middle. On the sides, the profiles of the lines that are marked on the frames are shown. The histogram of intensities presented exactly for the resulting frames is also given. Note that the range of gray colors in these histograms is the same as the range of intensities that are transformed into heights (first row, left). (Third row) Frames resulting from the height transformation according to the graph in the first row, left. Corresponding line profiles and height distributions are given. Note that the transformation uses now all 255 colors, but it is not changing the shape of the line profile nor the histogram. Gray areas in the graph are representing the bound part of the membrane. The upper boundary of these areas corresponds to the same cutoff height (37 nm) as determined from the membrane fluctuation analysis (first row, right). (Last row, sides) Extraction of the strong adhesion by the imposition of a threshold upon the frames from the fourth row at 37 nm. (Last row, middle) For better visualization of the contact zone, the brightness and the contrast of the frames from the fourth row is performed. For details, see text.

