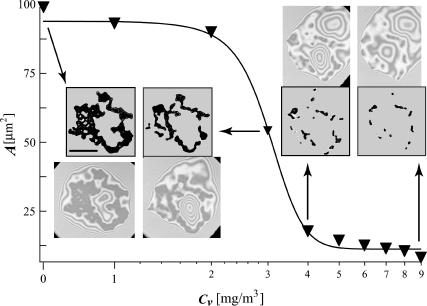
FIGURE 5.
Area of the adhesion patch as a function of the concentration of antibodies. The scale bar indicates the length of 10 μm. Data points are shown as inverted triangles. The line connecting the triangles is a sigmoid fitting function. Four original pictures are presented together with the pattern of strong adhesion patches that were extracted by image processing. Every data point was processed in exactly the same way and the error associated with each one is proportional to the ratio of the surface to the circumference of the patch. The arrows connect a given point with the original picture.

