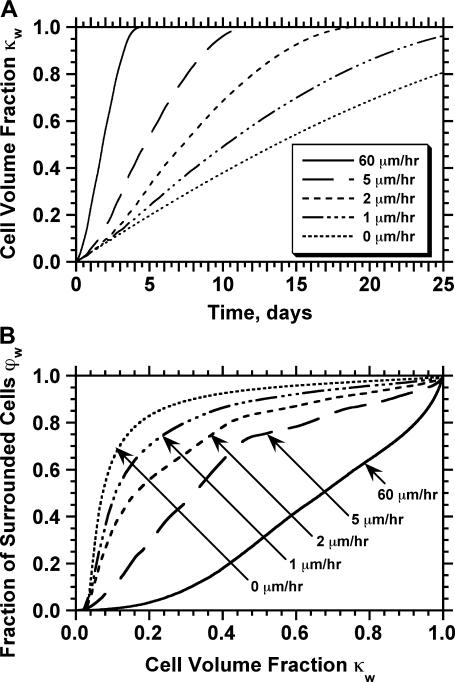
FIGURE 9.
Effect of cell migration speed S (shown in inset) on (A) the temporal evolution of cell volume fraction and (B) the  vs.
vs.  tissue growth pattern. These runs started with the wound mode of cell seeding, and all other run parameters are the same as in Fig. 8.

