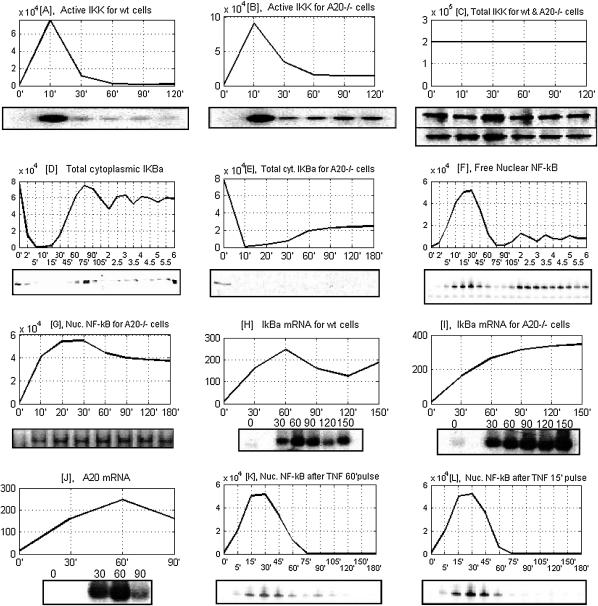
FIGURE 13.
Model predictions based on average over 500 runs versus the measurements of Hoffman et al. (19) and Lee et al. (16) on wild-type cells and A20-deficient cells. (A and B) Correspondence between an active pool of IKK, i.e., IKKa, and the data of Lee et al. (16) on IKK kinase activity for wild-type and A20−/– cells, assessed using the GST-IκBα substrate. (C) Level of total IKK (16) for wild-type (upper blots) and A20−/− cells (lower blots) remains almost constant—which, in our model, results from the assumption that degradation of all IKK forms proceeds at the same rate. (D and E) Total cytoplasmic IκBα, respectively, for wild-type cells and A20−/− cells, from the experiments of Hoffman et al. (19) and Lee et al. (16). (F and G) Nuclear NF-κB (EMSA assay), respectively for wild-type cells and A20−/− cells (16,19). (H and I) IκBα mRNA from Lee et al. (16), for, respectively, wild-type and A20−/− cells. (J) A20 mRNA level (16). (K and L) nuclear NF-κB in wild-type cells for, respectively, 60-min- and 15-min-long TNF stimulations (19).

