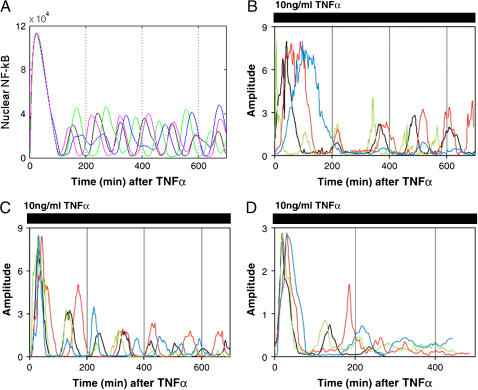
FIGURE 4.
Model simulations and measurements of Nelson et al. (26). Four single cell simulations (or experiments) are represented by differently colored lines. (A) Model simulations: nuclear NF-κB after a persistent TNF activation starting at t = 0. The total amount of NF-κB was elevated to 120,000 for this simulation. (B–D) Nuclear to cytoplasmic RelA-DsRed fluorescence normalized to highest peak intensity. Cells were treated with continual 10 ng/ml TNFα. (B) SK-N-AS cells co-expressing RelA-DsRed and IκBα-EGFP. (C) SK-N-AS cells expressing RelA-DsRed and EGFP control. (D) HeLa cells expressing both RelA-DsRed and IκBα-EGFP.

