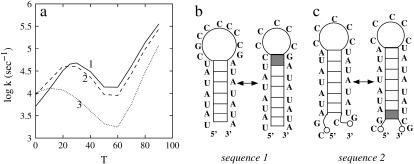
FIGURE 7.
(a) The temperature (T in °C) dependence of the relaxation rate for the three sequences with the GC pair at different positions in the stem. The folding processes are rate-limited by the formation of the rate-limiting stack (solid stack). Panels b and c show the dominant folding pathways for sequences 1 and 2, respectively.

