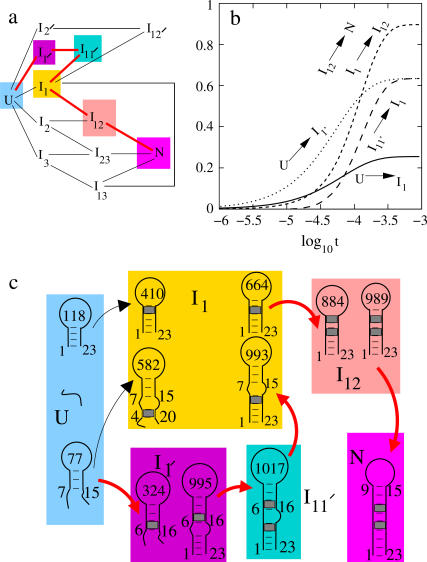
FIGURE 8.
(a) The kinetic connectivity of the 12-cluster system (the red lines show the main folding pathway). (b) The net fluxes for the intercluster transitions. The net flux curve for I12 → N nearly coincides with the curve for I1 → I12. This means that in the folding process, nearly all the chain conformations entering cluster I12 from I1 would fold into the native cluster N. (c) The main pathways (in red) for the folding at T = 40°C.

