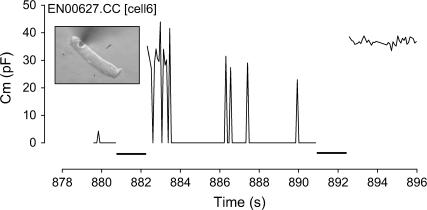
FIGURE 2.
Episodes of transient membrane breakdown followed by fast resealing are indicated by the spikes in Cm on this data trace reaching whole-cell levels. Voltage pulses are indicated by the thick lines on the x axis. Electroporation is noted at the end of the trace by the sustained increase in Cm after a voltage pulse.

