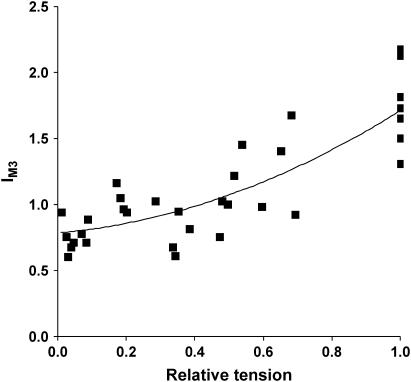
FIGURE 3.
Dependence of tetanic IM3 on relative tetanic tension at 2.2-μm sarcomere length. Tetanic tension was varied by changing [BDM]. IM3 was normalized to the intensity of the relaxed pattern, which showed no sensitivity to BDM. The line is a best fit of a quadratic regression of IM3 upon PBDM.

