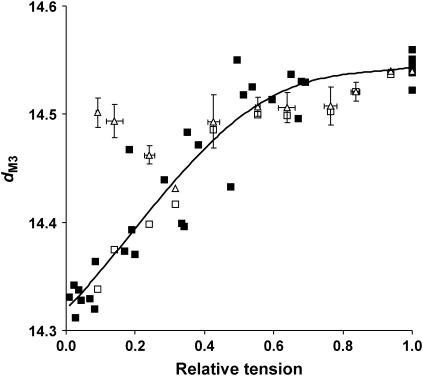
FIGURE 4.
(Solid squares) M3 spacing (dM3) in BDM plotted against active tension (PBDM/Po); (open triangles) dM3 plotted against active tension at different sarcomere lengths (Poverlap/Po). For overlap data, both dM3 and Poverlap/Po have been class-averaged to reduce scatter. Error bars are the standard errors for each class. The dependence of dM3 on PBDM/Po was fitted to a fourth-order polynomial (y = 0.5445x4 − 1.1758x3 + 0.5527x2 + 0.3019x + 14.32), which is plotted as the continuous line. (Open squares) The dM3 dependence on Poverlap/Po at different sarcomere lengths corrected for passive tension by subtraction of the passive component of the total change in dM3.

