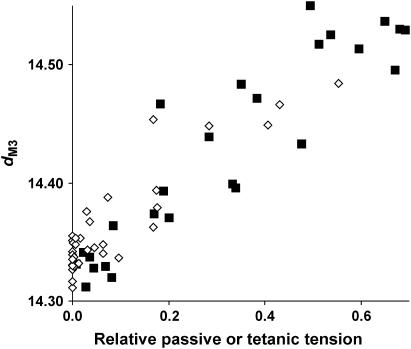
FIGURE 8.
Comparison of relaxed dM3 plotted against passive tension (⋄, expressed relative to tetanic tension at full overlap) at different sarcomere lengths and tetanic dM3 in the presence of BDM (▪) plotted at the corresponding active tension (expressed relative to tetanic tension in unmodified Ringer). Note that the two relations are superimposable. Note also that the data cover a force-range only up to 0.6 Po (where the slope of the plots is approximately constant), because this was the highest level of passive tension reached in the range of sarcomere lengths examined. Extension beyond this range of sarcomere lengths resulted in irreversible deterioration of the x-ray pattern.

