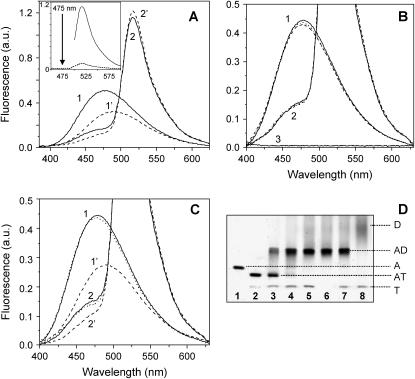
FIGURE 3.
Effect of tβ4 on the distance between Lys-61 and Cys-374 of actin. (A) Corrected and averaged fluorescence spectra (λex = 365 nm and λem = 520 nm) of IAEDANS-actin and IAEDANS/FITC-actin (1.5–3 μM) in the presence (dashed curves 1′ and 2′) and absence (solid curves 1 and 2) of 10-fold molar excess of tβ4. Conditions: G-buffer, 22°C. Spectra were normalized to a 100% acceptor labeling ratio. (Inset) The emission spectrum of FITC-actin excited at 520 nm (solid curve) and at 360 nm (dashed curve). (B) Effect of DNase I on the corrected and averaged fluorescence spectra of IAEDANS- and IAEDANS/FITC-actin (1.5–3 μM; solid curves 1 and 2, respectively) in the presence (dashed curves 1 and 2) and absence (dotted curves 1 and 2) of a 10-fold molar excess of tβ4. Curve 3 shows an emission spectrum of G-buffer. (C) The reverse order of ABP addition, i.e., tβ4 (dashed curves) followed by the DNase I (dotted curves). (D) A 10% Native PAGE gel. (Lane 1) IAEDANS/FITC-actin (3 μM) alone; (lane 2) 3 μM actin + 20 μM tβ4; (lanes 3–5) 1.5, 3, and 6 μM DNase I was added to the actin/tβ4 complex; (lane 6) 3 μM actin + 6 μM DNase I; (lane 7) 20 μM tβ4 + actin/DNase I complex (shown in lane 6); and (lane 8) 20 μM tβ4 + 6 μM DNase I.

