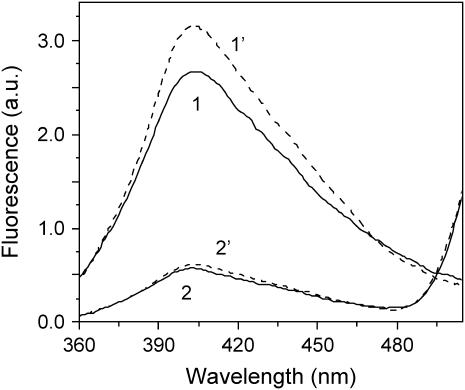
FIGURE 4.
Effect of tβ4 on the distance between bound ɛATP and Lys-61 of actin. Corrected and averaged fluorescence spectra (λex = 315 nm and λem = 415 nm) of ɛATP- and ɛATP/FITC-actin in the absence (solid curves) and presence of 10-fold molar excess tβ4 (dashed curves). The actin concentration was 1.5 μM in G-buffer containing 1 mM Tris/HCl pH 8.0 and 0.1 mM CaCl2. The temperature was 10°C. Spectra were normalized to a labeling ratio of FITC to actin equal to one.

