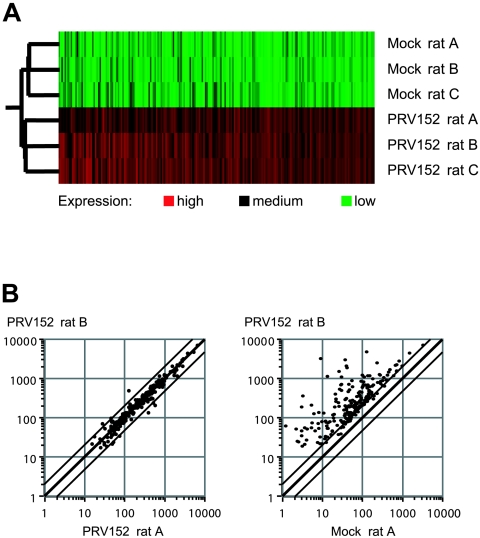
FIG. 1.
Graphic displays of microarray data. (A) Experiment tree showing reproducibility of gene expression data between triplicates (rats A, B, and C), as exemplified by complete sets of up-regulated genes from six GeneChips corresponding to mock- and PRV152-infected hypothalamic samples at 96 h postinfection. Data sets whose expression patterns are similar are clustered in nearby places in the tree; thus, the three mock-infected and the three virus-infected sets cluster together. Individual genes are shown as columns of rectangles, and expression levels are displayed colorimetrically in different shades of red or green or in black; expression of differentially regulated genes is low (green) or medium (black) in three out of three mock-infected samples and medium or high (red) in virus-infected samples. (B) Scatter plots showing variations in fluorescent signal intensities between two samples (rats A and B). Each dot corresponds to one differentially regulated gene, and parallel lines flanking the center line indicate twofold changes in intensities. Two samples from parallel infections with PRV152 (left) and an infected to a noninfected sample (right) are compared.

