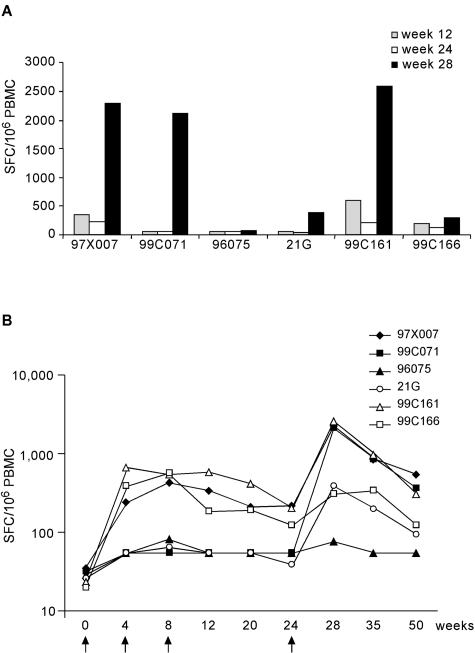
FIG. 7.
ELISPOT responses in naked DNA-primed, MRKAd6-NSmut-boosted rhesus monkeys. (A) DNA priming and MRKAd6-NSmut (108 viral particles) boosting in rhesus monkeys. ELISPOT responses are shown for individual monkeys after priming (T = 12 weeks), before boost (T = 24 weeks) and after boost (T = 28 weeks). Each bar represents the total anti-NS response, calculated by adding up the positive responses to individual NS peptide pools and correcting for DMSO background. Results are expressed as the number of IFN-γ SFC per 106 PBMC. (B) Strength and longevity of anti-NS ELISPOT responses induced in DNA primed- and /adenovirus-boosted monkeys over time. The line represents the geometric mean of total anti-NS ELISPOT responses of the six animals during a 50 week follow-up. The total anti-NS ELISPOT response was calculated for each time point and for each animal by adding up the positive responses to the individual NS peptide pools and correcting for DMSO background. Numbers on the y axis represent the number of IFN-γ SFC per 106 PBMC. Arrows indicate immunization dates.

