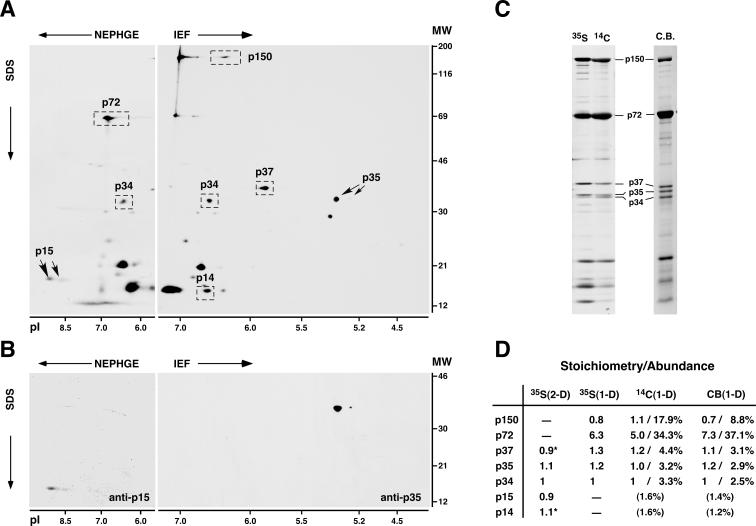
FIG. 1.
Gel mapping, stoichiometry, and relative abundances of ASFV polyprotein products in the virus particle. (A) 2-D gel electrophoresis of ASFV labeled with [35S]methionine. Basic proteins were resolved by NEPHGE, while acidic proteins were separated by IEF. The positions of the major capsid protein p72; the polyprotein pp220-derived products p150, p37, p34, and p14; and the polyprotein pp62-derived products p35 and p15 are indicated. The migrations of molecular weight (MW) markers (in thousands) and of pI markers are indicated at the right and at the bottom of the 2-D gels, respectively. (B) 2-D mapping of proteins p35 and p15. Protein p15 was mapped in NEPHGE gels by immunoprecipitation, whereas p35 was identified in IEF gels by immunoblotting. (C) 1-D gel electrophoresis of ASFV particles labeled with [35S]methionine or 14C-amino acids or stained with Coomassie blue (C.B.). The positions of several structural proteins are indicated. (D) Quantitative analysis of the polyprotein products. Polyprotein products and, as a reference, capsid protein p72 were quantified by densitometry analysis of 2-D gels of [35S]methionine-labeled proteins (two experiments) or of 1-D gels of ASFV proteins labeled with [35S]methionine (three experiments) or 14C-amino acids (two experiments) or stained with Coomassie blue (three experiments). Stoichiometry data were normalized by the number of methionine residues of each protein (for 35S-labeled proteins) or by its molecular weight (for 14C-labeled or Coomassie blue-stained proteins) and referred to protein p34. Relative abundances (percentages) were estimated from 1-D gels of 14C-labeled or Coomassie blue-stained proteins. Standard deviations of the means were less than 25% of the means. Proteins p150 and p72 were not quantified in 2-D gels due to deficient focusing, while proteins p15 and p14 were not estimated in 1-D gels because of heterogeneity of the bands. The relative abundances of proteins p15 and p14 are values extrapolated by assuming an equimolar stoichiometry. Stoichiometry data for p37 and p14 [marked with asterisks in the 35S(2-D) column] are from reference 4.

