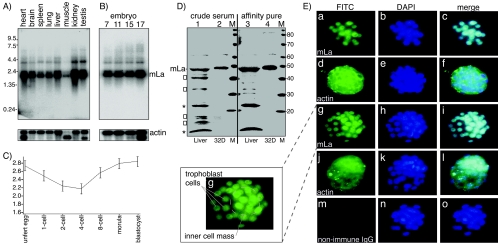
FIG. 1.
mLa is ubiquitously expressed throughout development and in adult mice. Northern blots of poly(A)+ RNA from (A) adult tissue and (B) 7- to 17-day-old embryos, probed with mLa cDNA. Size markers are indicated in kilobases on the left. The same blots were probed with beta-actin cDNA (bottom blots). (C) Expression pattern of La mRNA during preimplantation stages of early development as measured by microarray analysis as described previously (12). Morphological stages are indicated along the x axis (unfert egg, unfertilized egg). Values are means ± standard errors (error bars) from at least three independent hybridization results obtained for pools of 500 embryos for each stage of preimplantation development. RNAs were extracted from batches of 500 embryos at each stage of development. A universal mouse reference RNA was used for all hybridizations so that all stages could be compared to the same reference points. The y axis shows logarithm of signal intensity in arbitrary units relative to the control reference RNA (12). (D) Immunoblotting was used to characterize the Ab used for immunofluorescence shown in panel E. Lanes 1 and 3 contain adult mouse liver extract, and lanes 2 and 4 contain extract from mouse 32D cultured cells, which have previously been shown to express mLa protein (31). The blot on the left was incubated with crude anti-mLa serum, and the blot on the right was incubated with Ab that was affinity purified using highly purified mLa protein as the affinity matrix. Bands indicated by asterisks and brackets (>) are discussed in Results. The positions of molecular mass markers (lanes M) (in kilodaltons) are indicated to the right of the blot. (E) Immunofluorescence using affinity-purified anti-mLa Ab (a to c and g to i), antiactin (d to f and j to l), and nonimmune rabbit IgG (m to o). Primary Ab was visualized with FITC-conjugated anti-rabbit IgG. The samples were also stained with DAPI, and the FITC and DAPI images were merged as indicated.

