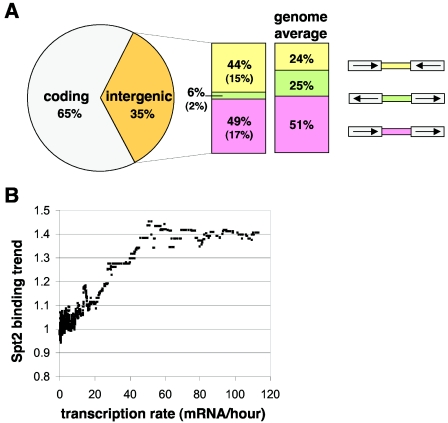
FIG. 2.
Spt2 associates predominantly with actively transcribed regions. (A) A pie chart of the distribution of the Spt2-enriched loci (P < 0.005) between coding and intergenic regions. For the 180 loci enriched for Spt2, the most enriched array feature was classified as coding (gray) or noncoding (intergenic; orange). The intergenic features were further subdivided into those containing two terminators (yellow), two promoters (green), or one promoter and one terminator (pink). The distribution of these three classes of intergenic regions across the whole genome is also shown (genome average). (B) Spt2 association correlates with transcription rate genome wide. The Spt2 binding trend is plotted against the transcription rate for all yeast genes. The binding trend was determined as described previously by computing a sliding median of the Spt2 binding ratios across all genes ordered by transcription rate (24, 26, 38, 39, 49, 66). The genome-wide transcription rate was determined previously (14).

