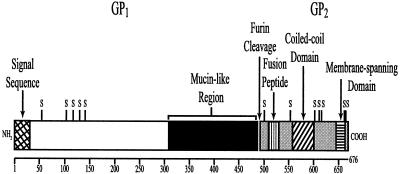
FIG. 1.
Schematic representation of Ebola virus GP. The GP1 and GP2 subunits of GP are drawn to scale (residue numbers are indicated below the diagram). The positions of the signal sequence (cross-hatching), conserved cysteine residues (S), the mucin-like region (region of O-linked glycosylation; black), the furin cleavage site, the fusion peptide (vertical lines), the coiled-coil domain (diagonal lines), and the membrane-spanning domain (horizontal line) are indicated.

