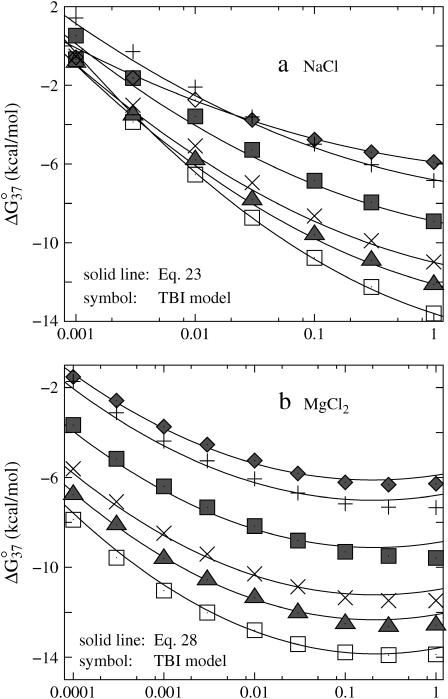
FIGURE 8.
The free energy change ΔG°37 for dsDNA helix formation as functions of (a) NaCl and (b) MgCl2 concentrations for the sequences: GCATGC, GGAATTCC, GCCAGTTAA, ATCGTCTGGA, CCATTGCTACC, and CCAAAGATTCCTC (from the top to bottom). (a) (Solid lines) The empirical relation Eq. 23; (symbols) calculated from the TBI theory. (b) (Solid lines) The empirical relation Eq. 28; (symbols) calculated from the TBI theory.

