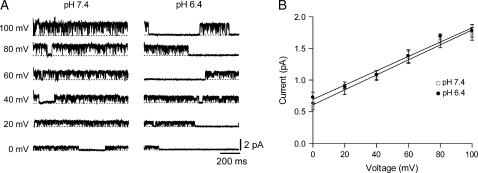
FIGURE 2.
Open channel current-voltage relationship showing the single channel conductance does not change with pH. (A) Representative unitary currents at voltages between 0 and 100 mV in 20 mV increments at pH 7.4 and 6.4. All traces shown were digitally filtered at 1 kHz. (B) Fitting a line to the i-V relationship at pH 7.4 (○) and pH 6.4 (•) gave a slope conductance (mean ± SD) of 11.8 ± 0.6 pS and 11.3 ± 0.8 pS, respectively. These values for the slope conductance were not significantly different.

