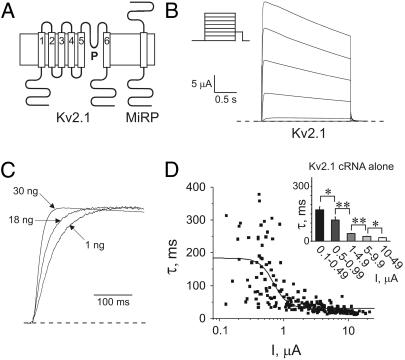
FIGURE 1.
Kv2.1 activation kinetics vary with expression level. (A) Cartoons showing predicted topologies of Kv2.1 and MinK (or related peptides). (B) Exemplar current trace generated from TEVC of oocytes injected with 30 ng Kv2.1 cRNA. Oocytes were held at −80 mV and stepped to voltages between −80 and +60 mV, with a −40 mV tail pulse (protocol, upper inset; scale bars, lower inset; zero current level, dashed line). (C) Scaled current at 0 mV for oocytes injected with 1, 18, or 30 ng of Kv2.1 cRNA (as indicated) illustrating current density dependence of activation kinetics (zero current level, dashed line). (D) Scatter plot of the relationship between the slow component of activation (τslow) and current density of Kv2.1; oocytes were injected with 1–30 ng Kv2.1 cRNA (n = 223 oocytes). Data were fit with a sigmoidal relationship (solid line). (Inset) Slow component of Kv2.1 activation kinetics versus binned current density for oocytes as in scatter plot. Asterisks indicate statistical significance as determined by one-way ANOVA: single asterisks, p < 0.05; double-asterisks, p < 0.01. Error bars indicate S.E.

