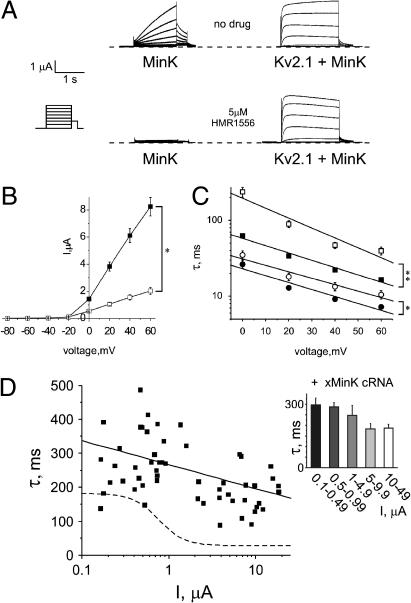
FIGURE 4.
Overexpressed xMinK slows Kv2.1 activation. (A) Exemplar current traces generated from TEVC of oocytes injected with 3 ng xMinK alone (left) or coinjected with 18 ng Kv2.1 cRNA (right), in the absence (upper panel) or presence (lower panel) of HMR1556 (5 μM) in the bath solution. Oocytes were held at −80 mV, then stepped to voltages between −80 mV and +60 mV with a −40 mV tail pulse (for protocol, see inset). (B) Mean current-voltage relationships from traces as in A for Kv2.1 (solid squares) or xMinK-Kv2.1 (open squares) channels, n = 15 oocytes per group. Error bars indicate mean ± SE. Single asterisk indicates significant difference between groups at 0–60 mV, p < 0.001. (C) Time constants for double-exponential fits of activation to peak currents for Kv2.1 (solid square, τslow; solid circle, τfast; and xMinK-Kv2.1: open square, τslow; open circle, τfast; and n = 15 oocytes per group). Error bars indicate SEM. The single asterisk indicates significant difference between groups at 20–60 mV, p < 0.05. The double-asterisk indicates significant difference between groups at 0–60 mV, p < 0.0001. (D) Scatter plot of the relationship between the slow component of activation (τslow) and current density for oocytes coinjected with 1–30 ng Kv2.1 cRNA and 3 ng xMinK cRNA (n = 56 oocytes); solid line is a linear fit of the data. Dashed line, sigmoidal fit of data from Fig. 1 D (Kv2.1 cRNA alone). (Inset) Slow component of activation kinetics versus binned current density for oocytes as in scatter plot.

