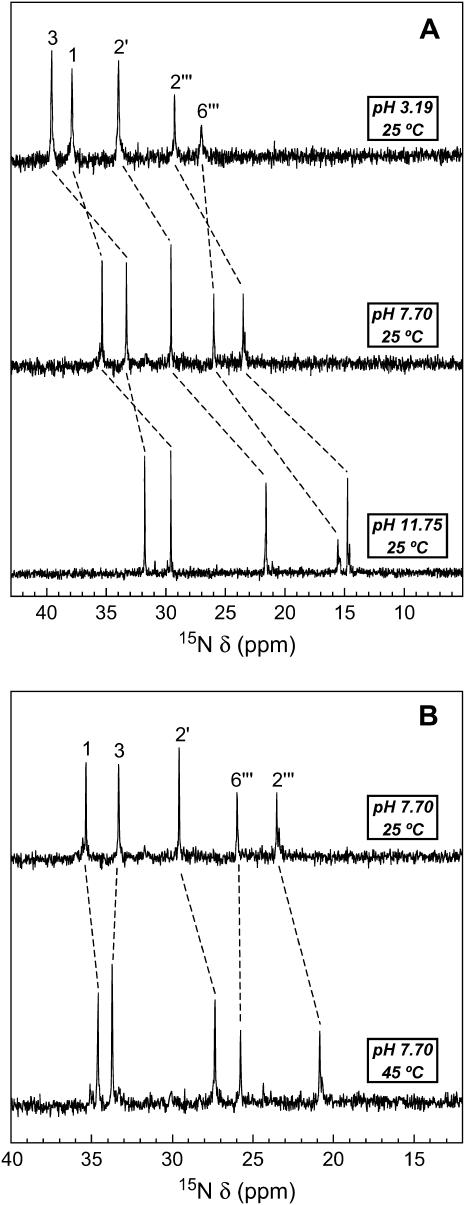
FIGURE 2.
Temperature and pH dependence of the 15N NMR spectrum of the free base form of paromomycin. The resonances corresponding to the five amino nitrogens are indicated, with the pH- and temperature-induced shifts of these resonances being denoted by the dashed lines. The 15N chemical shifts (δ) are reported relative to NH3 using 1 M [15N]urea in DMSO as an external standard, with the 15N chemical shift of the reference set to 77.0 ppm. (A) 15N NMR spectra of the free base form of paromomycin at 25°C and pH values of 3.19 (top), 7.70 (middle), and 11.75 (bottom). (B) 15N NMR spectra of the free base form of paromomycin at pH 7.70 and temperatures of 25°C (top) and 45°C (bottom).

