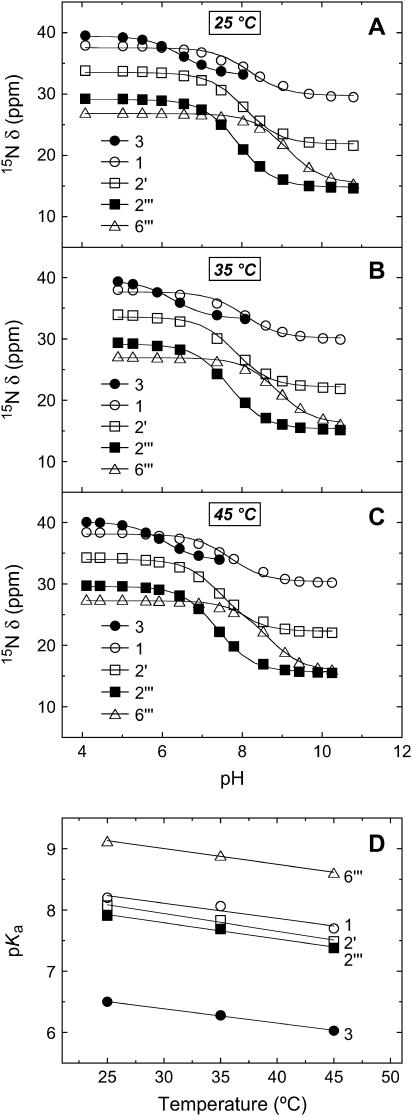
FIGURE 3.
pH dependence of the 15N chemical shifts (δ) of the free base form of paromomycin at 25°C (A), 35°C (B), and 45°C (C). The 15N chemical shifts are reported as described in the legend to Fig. 2. The continuous lines reflect the calculated fits of the experimental data using Eq. 5. (D) Temperature dependence of the pKa values for the five paromomycin amino groups. The experimental data points were fit by linear regression to yield the solid lines.

