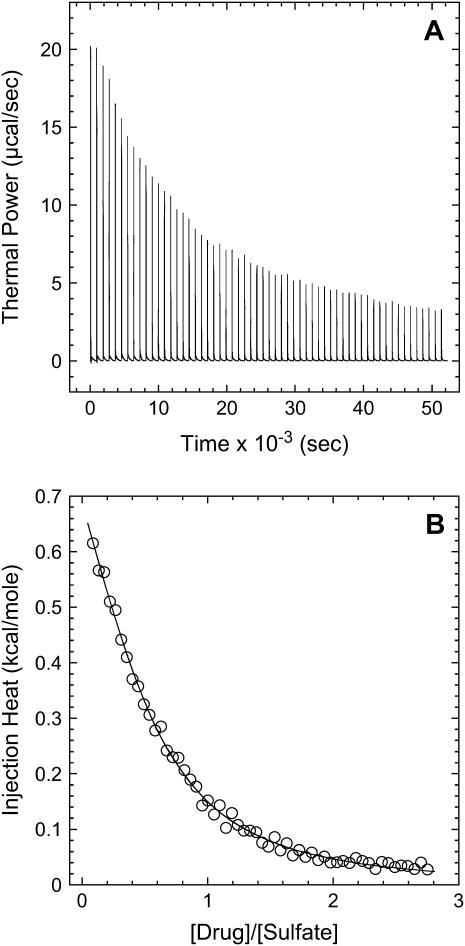
FIGURE 4.
ITC profile (acquired at 25°C and pH 7.0) for the titration of the free base form of paromomycin into a sodium sulfate solution. Each of the heat burst curves in panel A is the result of a 5-μL injection of 125 mM paromomycin, with the sodium sulfate concentration being 10 mM. The corrected injection heats shown in panel B were derived by integration of the heat burst curves in panel A, followed by subtraction of the corresponding dilution heats resulting from control titrations of drug into water alone. The data points in panel B reflect the corrected injection heats, while the continuous line reflects the calculated fit of the data using a model for one set of binding sites.

