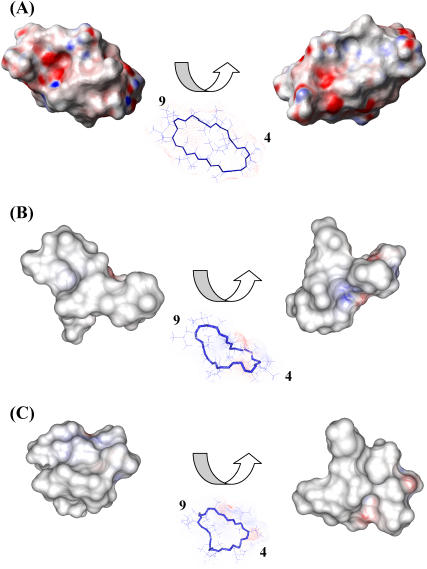
FIGURE 9.
Electrostatic potential surface of free CsA (A), the CsA-Mg(II) complex (B), and the CsA-Ce(III) complex (C); positively charged regions are shown in blue, negatively charged ones in red, and hydrophobic ones in white/gray. For each structure two views are shown, rotated by 180° with respect to one another.

