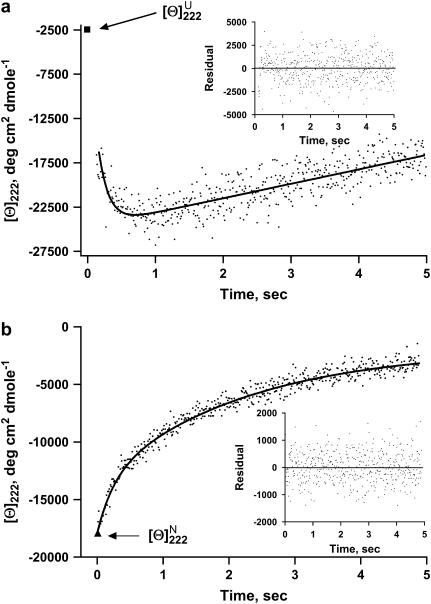
FIGURE 1.
(a) Kinetic refolding curves for full-length apoAI measured by far-UV CD at 222 nm and converted to MRE units. Refolding reaction was initiated by a GdnHCl concentration jump from 5 M to 0.45 M. The experimental data (dots) were fitted with Eq. 3 (solid line). The inset shows the difference between the theoretical curve and the experimental data. The single data point represented by a solid square at the top left corner of the graph is the MRE value at 222 nm of the native protein. (b) Kinetic unfolding curves for full-length apoAI measured by far-UV CD at 222 nm and converted to MRE units. Unfolding reaction was initiated by a GdnHCl concentration jump from 0 M to 4.55 M. The experimental data (dots) were fitted with Eq. 3 (solid line). The inset shows the difference between the theoretical curve and the experimental data. The single data point represented by a solid triangle at the bottom left corner of the graph is the MRE value at 222 nm of the unfolded protein.

