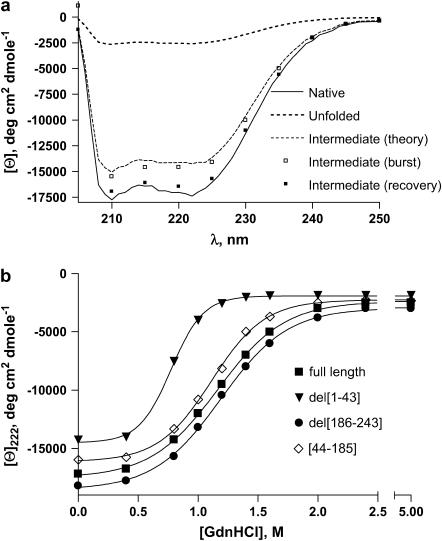
FIGURE 2.
(a) CD spectra of full-length apoAI in the far-UV region. Shown are spectra of the protein in the native (N, solid line, 0 M GdnHCl), unfolded (U, dotted line, 5 M GdnHCl), and intermediate (I, dashed line) forms calculated with Eq. 15, as explained in the text. Open squares represent the CD spectrum of the burst phase intermediate and the solid squares represent the spectrum of the recovery phase intermediate, as explained in the text. (b) MRE at 222 nm as a function of concentration of GdnHCl, measured at equilibrium, for the following forms of apoAI (corresponding EC50 values are also indicated): full-length (squares, 1.17 M), del[1–43] (triangles, 0.77 M), del [186–243] (circles, 1.19 M), and [44–185] (diamonds, 1.11 M).

