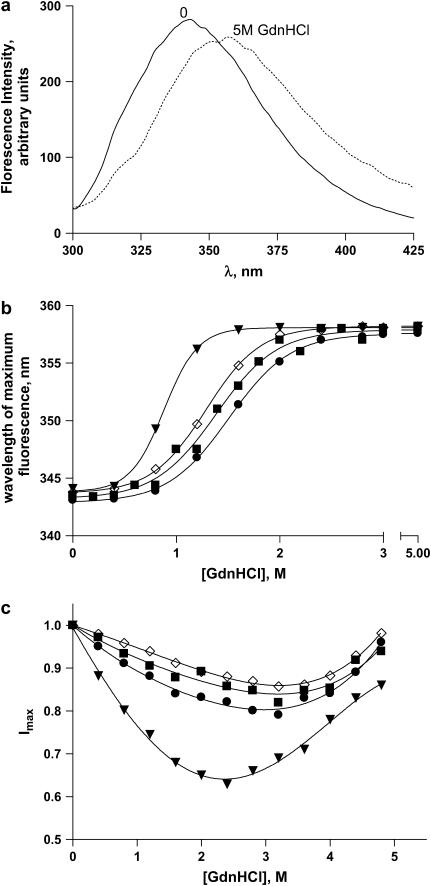
FIGURE 3.
(a) Fluorescence spectra of full-length apoAI at 0 and 5 M GdnHCl, as indicated on the graphs. λexc = 295 nm. (b) WMF and EC50 values as a function of GdnHCl concentration measured at equilibrium for full-length apoAI (squares, 1.38 M), del[1–43] (triangles, 0.88 M), del[186–243] (circles, 1.51 M), and [44-185] apoAI (diamonds, 1.29 M). λexc = 295 nm. (c) Fluorescence intensity at the peak of emission spectrum as a function of GdnHCl concentration measured at equilibrium for full-length apoAI (squares), del[1–43] apoAI (triangles), del[186–243] apoAI (circles), and [44–185] apoAI (diamonds). Symbols represent the experimental data and lines represent the theoretical curves predicted by Eq. 13. λexc = 295 nm.

