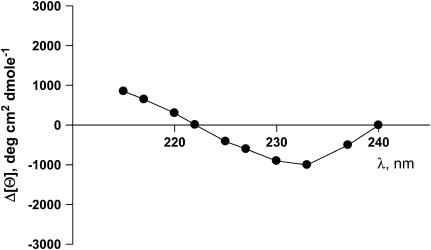
FIGURE 5.
Kinetic difference spectrum of the refolding of full-length apoAI from I to N. Data were calculated from kinetic CD spectra acquired at 10 different wavelengths, as indicated, during refolding experiments of apoAI upon GdnHCl concentration jumps from 5 M to 0.45 M. The spectra were calculated as the difference in the preexponential amplitudes of the recovery phase and the slow decay phase as illustrated in Fig. 1 A.

