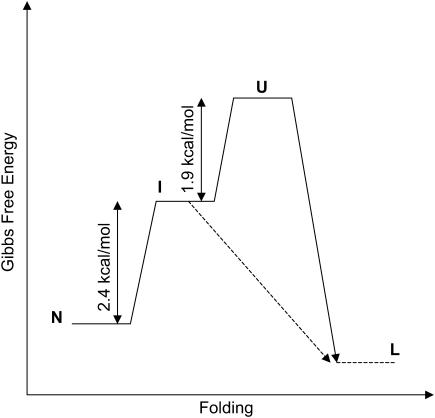
FIGURE 6.
Gibbs free energy diagram for the different states of apoAI. The free energy changes given in Table 2 for transitions between the different states of the protein are also indicated. A putative transition between the intermediate state (I) and lipid bound protein (L) is also depicted in the diagram. The existence of a folding intermediate state would lower the free energy barrier for lipid binding of apoAI.

