
TABLE 2.
Thermodynamic parameters for equilibrium unfolding of apoAI mutants
| Wild-type apoAI
|
del[1–43] apoAI
|
del[186–243] apoAI
|
[44–185] apoAI
|
|||||||||
|---|---|---|---|---|---|---|---|---|---|---|---|---|
| Parameter | I | II | III | I | II | III | I | II | III | I | II | III |
 |
2.4 ± 0.2 | 1.6 ± 0.1 | 3.5 ± 0.3 | 1.8 ± 0.1 | ||||||||
 |
1.9 ± 0.2 | 1.0 ± 0.1 | 1.8 ± 0.1 | 2.0 ± 0.2 | ||||||||
 |
4.5 ± 0.4 | 4.7 ± 0.4 | 4.3 ± 0.4 | 2.4 ± 0.2 | 2.2 ± 0.2 | 2.6 ± 0.2 | 5.1 ± 0.4 | 4.7 ± 0.4 | 5.3 ± 0.4 | 3.2 ± 0.3 | 3.4 ± 0.3 | 3.8 ± 0.3 |
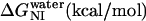
| mNI (kcal/mol) | 2.1 ± 0.2 | 1.2 ± 0.1 | 3.1 ± 0.3 | 1.9 ± 0.2 | ||||||||
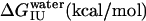
| mIU (kcal/mol) | 1.4 ± 0.1 | 0.8 ± 0.1 | 2.1 ± 0.2 | 1.2 ± 0.1 | ||||||||
| mNU (kcal/mol) | 3.6 ± 0.3 | 3.9 ± 0.3 | 3.5 ± 0.3 | 1.9 ± 0.2 | 1.8 ± 0.2 | 2.0 ± 0.2 | 5.1 ± 0.5 | 4.7 ± 0.5 | 5.2 ± 0.5 | 2.8 ± 0.2 | 2.6 ± 0.2 | 3.1 ± 0.3 |