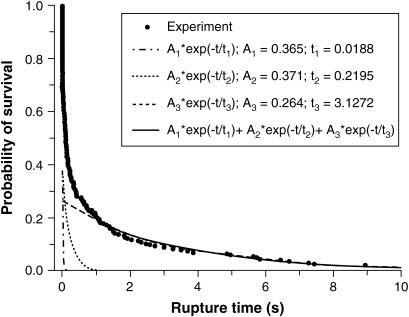
FIGURE 5.
The survival probability versus the rupture time for CEC1-5 bonds held at 40 pN. The circles are the experimentally measured survival probabilities. The solid line through the data is the superposition of the three exponential functions indicated by the dashed (A1), dotted (A2), and dash-dot curves (A1).

