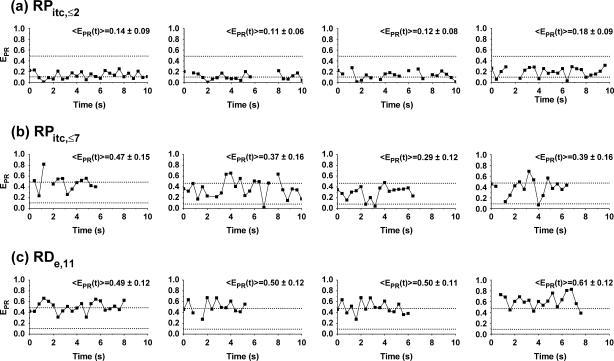
FIGURE 6.
Single-molecule time traces  traces are plotted as a function of time, for different representative complexes (Cy5, +25). Only time points with active donors and acceptors are shown. The average
  values obtained for RPitc,≤2 and RDe,11 (0.11 and 0.5, respectively) are represented by two horizontal lines to guide the eye. (a) RPitc,≤2, static distribution with
  ∼ 0.11 (see Fig. 5 a). (b) RPitc,≤7, scattered distribution with a majority of time points distributed around a relatively high
  (t) value (distribution centered around
  = 0.3 for the active molecules (see Fig. 5 c)), consistent with the forward translocation of the leading edge of RNAP relative to downstream DNA during abortive initiation. (c) RDe,11, static distribution with
  ∼ 0.5 (see Fig. 5 d).

