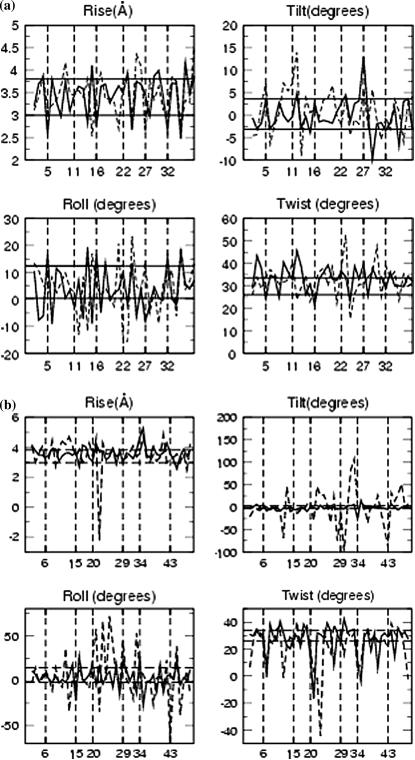
FIGURE 7.
Average rise, tilt, roll, and twist for (a) PX65 and (b) PX95. Solid line is for helix1 and broken line is for helix2. The vertical lines correspond to the crossover points. The data has been averaged over the last 200 ps of the 3-ns MD simulation. The horizontal solid lines gives the upper bound and lower bound for the corresponding quantities expexted for the helices in their B-DNA form (non-crossover form) during the MD simulation.

