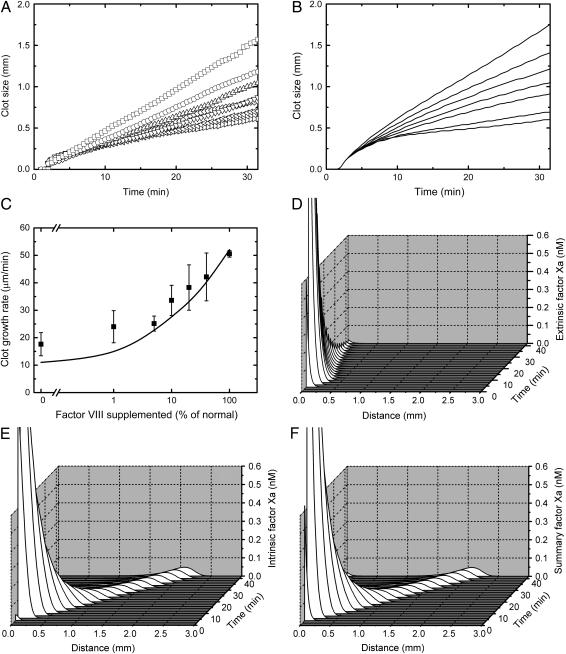
FIGURE 2.
Contribution of intrinsic and extrinsic tenases to spatial clot formation. Clots were formed on the surface of a fibroblast monolayer, as described in Materials and Methods. (A and B) Clot size versus time plots of clot formation in the plasma of a hemophilia A donor supplemented with normal plasma, from (A) a representative experiment (out of a total of four) and (B) the respective simulation. Normal plasma was at 0, 1%, 5%, 10%, 20%, 40%, and 100% v/v (bottom to top). (C) The rate of spatial clot growth in hemophilia A plasma versus concentration of added normal plasma, with experiments represented by symbols and simulations by the solid line. Mean values ± SD are shown, n = 4. (D–F) Simulated profiles of fXa during clot formation in normal plasma produced by (D) extrinsic tenase, (E) intrinsic tenase, and (F) both. A movie for this figure is available (see Supplementary Material).

